


Whether it's a small university research or a large enterprise activity, project owners often face similar challenges. They need to maintain consistent quality, track team productivity effectively, and avoid extra costs — no matter what tools they use.
CVAT addresses these challenges by providing clear, detailed, and easy-to-understand analytics that includes all the necessary metrics for annotation projects, tasks, and jobs. This allows managers to effortlessly monitor progress, pinpoint productivity bottlenecks, making the annotation workflows smoother and more efficient.
But what exactly does CVAT Analytics offer, how do you access Analytics data, and how can you practically use it in your projects?
In this article, you'll discover how CVAT Analytics helps to approach these challenges by providing practical tools and actionable insights.
What is CVAT Analytics?
CVAT Analytics provides insightful metrics for project managers and annotation teams to monitor and improve the annotation workflows. The following outlines the types of metrics that can be tracked:
- Working time: See exactly how much time annotators spend on tasks.
- Monitoring time allocation for job stages: Track how long each stage of annotation takes, helping identify slow stages.
- Quantifying total objects annotated: Keep accurate counts of annotated objects to evaluate productivity.
- Measuring annotation speeds: Monitor the pace at which annotations are completed and identify efficient annotators or potential issues.
- Identifying annotation activity and label usage: Gain insights into how labels are being used and annotation patterns.
Accessing CVAT Analytics
Analytics is available only to users with paid CVAT Online plans or with CVAT Enterprise. The level of access users have depends on their role within CVAT:
- Owners and Maintainers: Can access analytics for all projects, tasks, and annotation jobs across their workspace. For example, a project owner can review metrics of all team activities to estimate the overall productivity and resource allocation.
- Supervisors: Can access analytics data only for the projects, tasks, and jobs they have visibility over. For instance, a supervisor overseeing two specific tasks can see analytics for those tasks but not other unrelated projects.
- Workers: Have access only to analytics related to tasks and jobs assigned directly to them. For example, an annotator will see metrics for their assigned job, allowing them to track their own productivity and performance.
Navigating CVAT Analytics
To access analytics data in CVAT, navigate to the overview page where all your projects, tasks, or jobs are listed. Find the specific project, task, or job for which you need analytics data, click the three-dot menu next to it, and select "Analytics."

When opening the Analytics page for the first time, no data will be displayed immediately. You'll need to click the "Request" button to load the data. This will gather analytics for the selected item and any associated tasks or jobs.
Whenever updated analytics are needed, simply click the "Request report update" button to refresh the metrics.

Understanding the Analytics Page
The Analytics page in CVAT is divided into several tabs, each giving a different view of annotated data to help with tracking progress and improving performance.
The Summary tab gives you a quick overview of key project metrics.
By default, data is shown for the entire lifetime, but it can be filtered by specifying a UTC start and end date. You can also view the number of created and deleted objects, along with the overall difference in the Objects Diff section. Total Working Time displays the cumulative time spent across all events. Average Annotation Speed indicates the average number of objects annotated per hour.

You’ll also see the total working time spent by all annotators, and the average annotation speed, calculated in the number of annotated objects per hour.

Scroll down to view pie charts displaying annotation data for shapes and tracks, broken down by type and label. Hover over each segment to see a tooltip with additional information.
The Annotations tab breaks down annotation statistics further, depending on the type of annotation.
The Detection tab shows count by shapes, there you’ll find a number of objects labeled per category (polygons and masks). This is useful when you want to check whether the distribution of labels aligns with your dataset goals.

In the Tracking tab, you’ll get data on how many keyframes, interpolated frames, and object tracks were annotated.

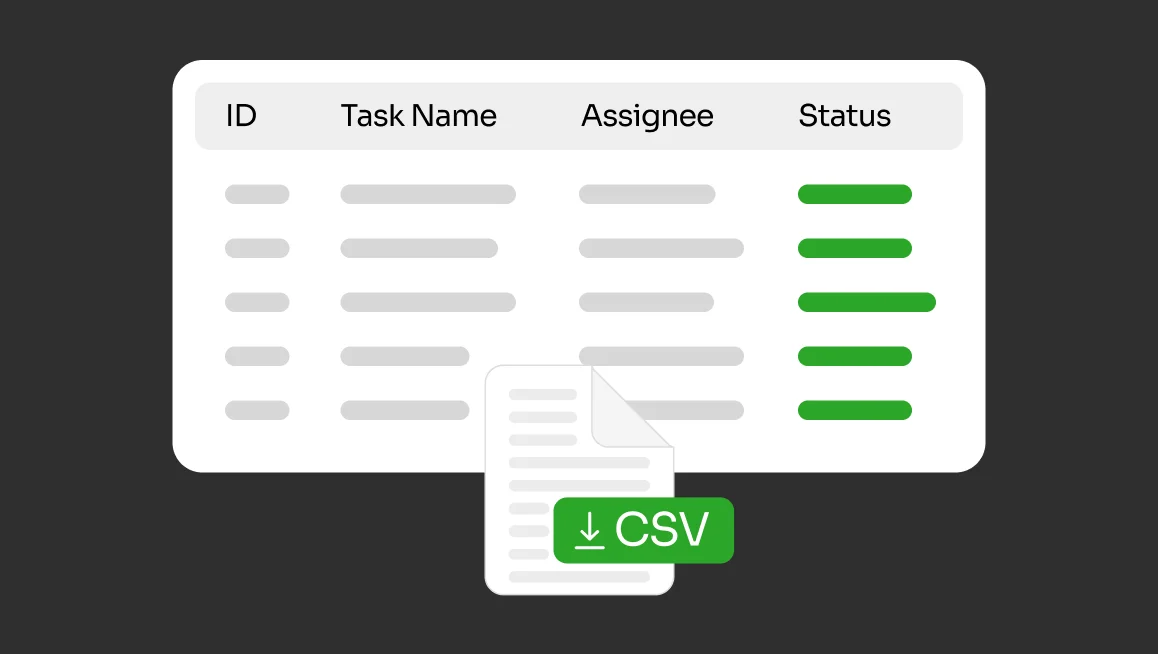
Both views come with searchable, filterable tables that you can export annotation statistics or raw events if needed.
The Events tab gives a deeper look into what happened and when. This is the most important tab. This tab allows you to track how, when, and by whom each child's job was changed. It shows how everything changed over time.
The Total objects, Total images, Total working time, and Avg. annotation speed, which are recalculated automatically depending on the selected filters.
You can see who the task and job were assigned to, as well as the annotation stage and current status.
On all three tabs of the Analytics page, you can use the calendar to select the time period for which you want to view analytics.

For example, you can see if a particular annotator spent extra time in a specific stage or made a excessive number of edits. This level of detail helps identify inconsistencies or inefficiencies in the workflow. Events are grouped based on the job's status and who performed the actions, making it easier to follow the history of work done over time.
The Export Events button downloads raw, non-aggregated event data based on the selected dates for users who need custom analytics beyond what's shown on the Events tab.
Each table allows users to customize visible columns. Note that not all columns are shown by default on the Events tab.
Best Practices for Using CVAT Analytics
To get the most out of CVAT Analytics, many teams apply a few simple habits that make a big difference in their workflow. These practices help ensure annotations are not only accurate but also completed efficiently.
For instance, in a project focused on labeling traffic signs for autonomous vehicles, a small team of annotators works across multiple batches of city footage. The project manager downloads and reviews analytics reports every Friday. They look for patterns like a sudden drop in label volume or a spike in rejected tasks. Lets say, one of team members has consistently low object counts after a schema change.Weekly review helps the manager catch this early and leads to a quick clarification of the labeling rules. Without the analytics check, several batches could have gone out with missing data.
In another scenario, a healthcare research group is annotating MRI scans with regions of interest. Different annotators handle different patient sets. Over time, the team notices that one annotator is completing far fewer images than the others. Analytics shows they spend significantly more time per image, because, as it turned out, they’re unsure how to label edge cases in a new category. With that insight, the team arranges a brief retraining session and updates their labeling guide. Productivity improves, and uncertainty drops across the board.
Monitoring quality metrics can also prevent wasted effort on downstream tasks. In a project detecting damaged packages from warehouse photos, annotation speed and object counts are tracked closely. If an annotator suddenly doubles their speed but the object count per image drops, it may signal they’re rushing or misunderstanding instructions. This could be due to the fact that a new guideline wasn't fully communicated, and several batches had to be rechecked. Having access to annotation speed and density trends helped the lead catch the issue before model training began.
How to Use CVAT Analytics: Step-by-Step Guide
CVAT Analytics helps teams keep their annotation projects on track by showing clear, useful data. It makes it easier to spot problems early, check the quality of work, and make sure tasks are shared fairly among team members. Whether the project is small or large, using analytics regularly can save time and improve results
Still have questions? Check out the Analytics documentation or watch a short video that explains everything in detail.
Ready to explore the new analytics? Create a CVAT Online account to get started, or contact us to deploy CVAT on your own premises.


.svg)
.png)

.png)


.png)